Concentrated Stock
Quarterly Update
Quarterly Update
Q3 2022
Highlights
- For the fifth time this year, the Fed increased the key interest rate in a clear statement that the central bank will remain aggressive until inflation is under control
- Our stock scoring models are bullish on energy as OPEC+ cut oil production and crude oil futures reached 14-year highs
- The total put-call ratio in the options market edged up during the third quarter as volatility rebounded
- PORTFOLIO INSIGHTS: how NorthCoast tax efficiently manages and liquidates concentrated stock portfolios

Amish Dalal, CFA
Senior Vice President
Portfolio Management
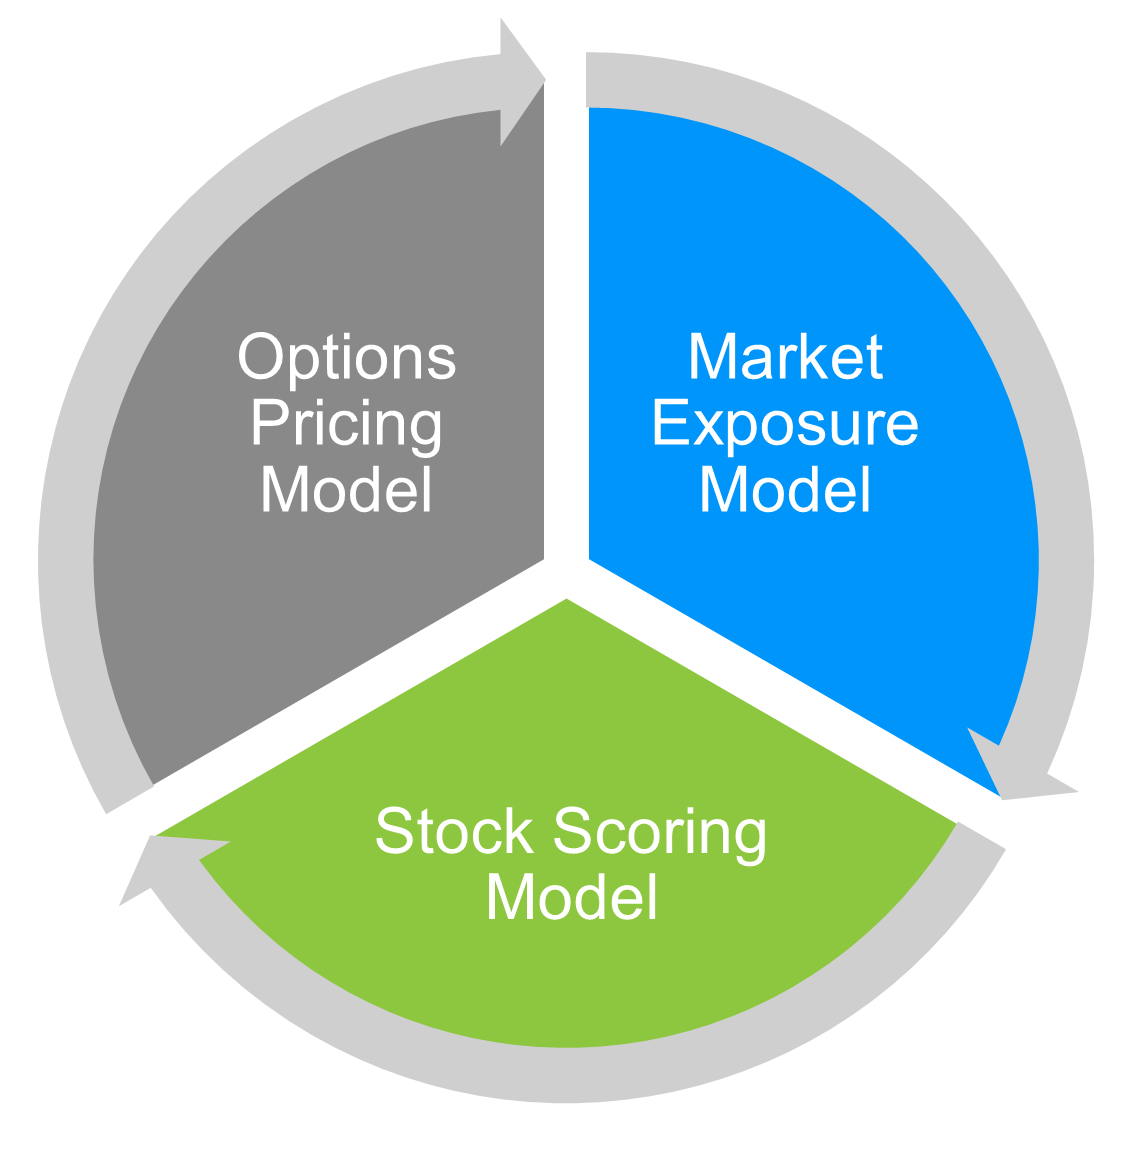
Concentrated Stock Triple Play Market Commentary
Market Exposure Model
Market volatility reemerged in the second half of September, most notably after the last FOMC meeting. During the third quarter, the S&P 500 fell 4.9%, the Nasdaq tumbled 4.1%, and the Dow lost 6.7%. Major catalysts for the downward market trend in September were stubbornly high inflation and the Federal Reserve reasserting that monetary policy will be tighter for a longer period.
Market volatility reemerged in the second half of September, most notably after the last FOMC meeting. During the third quarter, the S&P 500 fell 4.9%, the Nasdaq tumbled 4.1%, and the Dow lost 6.7%. Major catalysts for the downward market trend in September were stubbornly high inflation and the Federal Reserve reasserting that monetary policy will be tighter for a longer period.
Stock Scoring Model
In the third quarter, our stock selection models outperformed the large-cap universe by 1.4%. We are overweight energy primarily due to the higher projected demand for oil during the winter months and the constrained oil supply caused by the ongoing Russia-Ukraine conflict. However, our position on consumer staples and utilities remains negative as inflation erodes consumer purchasing power and is expected to dampen growth.
In the third quarter, our stock selection models outperformed the large-cap universe by 1.4%. We are overweight energy primarily due to the higher projected demand for oil during the winter months and the constrained oil supply caused by the ongoing Russia-Ukraine conflict. However, our position on consumer staples and utilities remains negative as inflation erodes consumer purchasing power and is expected to dampen growth.
Options Pricing Model
Market volatility started to climb again in September after a pullback in July, most notably after the last FOMC meeting. The primary drivers were the still-high inflation readings, a hawkish tone by the Fed, and uncertainty with global oil supplies. As a result of central bank policy towards combatting inflation, the US dollar, as gauged by the US Dollar Index which values the dollar relative to a basket of foreign currencies, soared to 20-year highs.
Market volatility started to climb again in September after a pullback in July, most notably after the last FOMC meeting. The primary drivers were the still-high inflation readings, a hawkish tone by the Fed, and uncertainty with global oil supplies. As a result of central bank policy towards combatting inflation, the US dollar, as gauged by the US Dollar Index which values the dollar relative to a basket of foreign currencies, soared to 20-year highs.

Volatility and Demand for Downside Protection in the Options Market
After a brief respite, volatility returned to the markets as Europe faces an economic slowdown and US recession fears rise. The below graph shows the VIX, which represents the implied volatility of the markets, and some of the year’s significant events.

During times of market stress, the index jumps. The VIX ended the third quarter at 31—meaningfully higher from the 5-year average of 20.
Meanwhile, the European energy crisis remains a considerable challenge, and we believe it will profoundly affect growth in Europe. The crisis could also have a spillover effect on other economies in the form of higher prices and slower growth. We see more volatility in the equity market down the road and believe that a cautious approach and thoughtful portfolio construction can lead to more resilient portfolios.
The put / call ratio, a measurement of the trading activity of put options compared to call options that was introduced in the prior Quarterly Update, continues to trend upward as the probability of a US recession climbs and investors seek protection.

Generally, a ratio greater than 0.7 indicates bearish sentiment. The ratio is currently elevated and the 30-day average at September month-end reached 1.07.
Despite the market sell-off year-to-date, our covered call and collar strategies in general have performed well as short call options overwhelmingly expired out-of-the-money and long put options dampened the downside price action. But in some cases, there are year-to-date losses on options or loss carryforwards from prior years. In the following section, we discuss how NorthCoast uses both gains and losses to sell down concentrated stock positions gain/loss- or cost-neutrally.
Portfolio Insights: Managing and Liquidating a Concentrated Stock Position Tax-Efficiently Over Time
One of the main features of NorthCoast’s Concentrated Stock solutions is the gradual and tax-efficient liquidation of concentrated stock positions. We accomplish this with an options overlay.
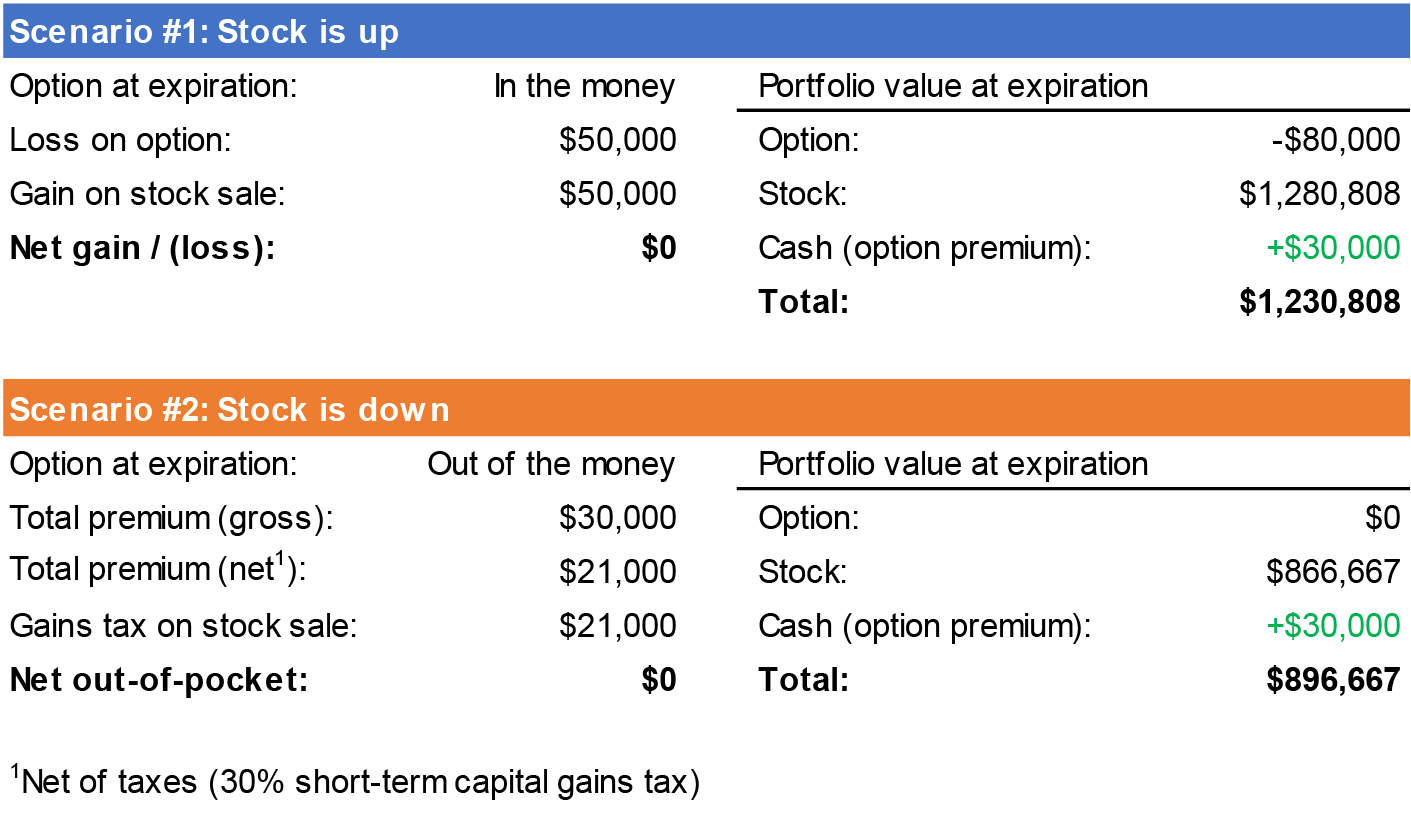
With the covered call strategy, we write call options on the stock primarily to generate premiums. If the stock rallies significantly, we may close out of the options prior to expiration to protect the underlying position from call-away risk, often booking a capital loss. In these situations, we can typically use the realized losses from the options to sell shares that produce an equivalent amount of gains with the objective being net gain / loss neutral. But if the stock closes below the strike price by the expiration date, the calls expire out-of-the-money and we may sell shares such that the capital gains tax due from the stock sale is covered by the net option premium, a cost-neutral tactic.
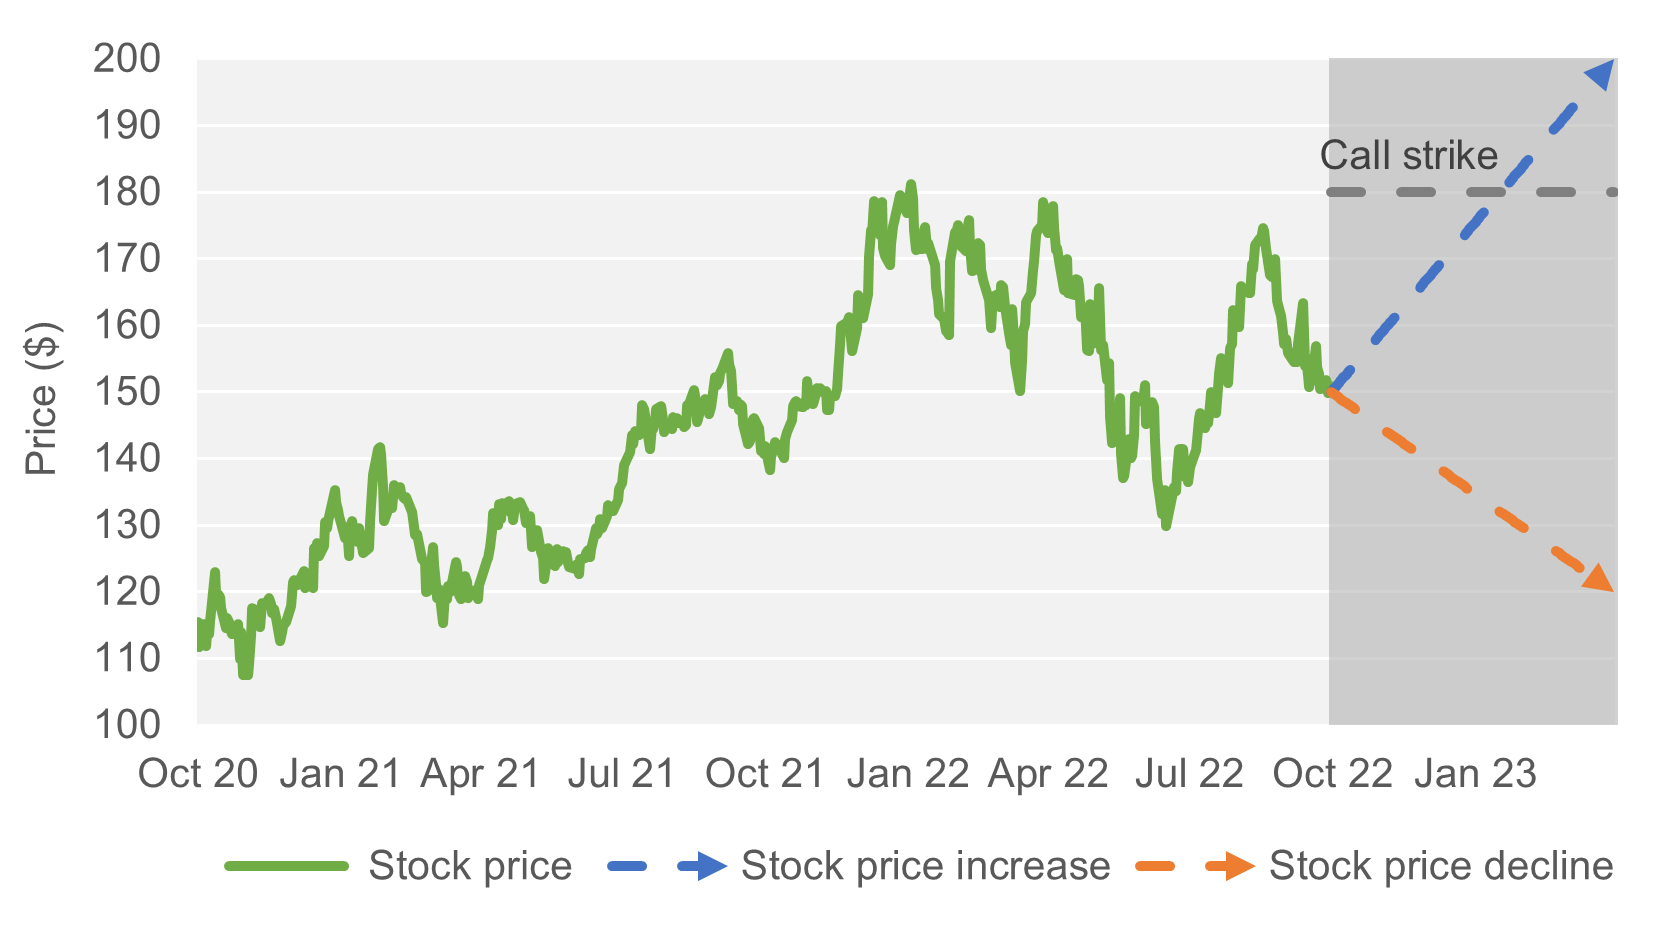
For example, a hypothetical client holds a $1mm position in ABC stock with $500k cost basis. The position is a long-term holding with a $500k unrealized gain. Rather than selling the stock immediately and paying the capital gains tax, the client enrolls in our strategy. We write a 6-month covered call with a $180 strike price that serves as an upper limit where the return is capped. The covered call generates $30k in income from the option premium. The below diagram illustrates what happens when the stock trends up and when it trends down.


Interested in learning how our Concentrated Stock Triple Play strategy can help your portfolio? Contact your NorthCoast advisor, or email us at info@northcoastam.com.
NorthCoast Asset Management is a d/b/a of, and investment advisory services are offered through, Connectus Wealth, LLC, an investment adviser registered with the United States Securities and Exchange Commission (SEC). Registration with the SEC or any state securities authority does not imply a certain level of skill or training. More information about Connectus can be found at www.connectuswealth.com.
Information provided is for illustrative purposes and is not a trading recommendation. Gain/loss results could vary based on market conditions at time of trade execution and actual cost basis of your holdings. This document does not constitute tax advice; please consult a tax professional for tax guidance.
NorthCoast and its affiliates do not provide tax, legal or accounting advice. This material has been prepared for informational purposes only, and is not intended to provide, and should not be relied on for, tax, legal or accounting advice. You should consult your own tax, legal and accounting advisors before engaging in any transaction.
The information contained herein has been prepared by NorthCoast Asset Management ("NorthCoast") on the basis of publicly available information, internally developed data and other third party sources believed to be reliable. NorthCoast has not sought to independently verify information obtained from public and third party sources and makes no representations or warranties as to accuracy, completeness or reliability of such information. All opinions and views constitute judgments as of the date of writing without regard to the date on which the reader may receive or access the information, and are subject to change at any time without notice and with no obligation to update. This material is for informational and illustrative purposes only and is intended solely for the information of those to whom it is distributed by NorthCoast. No part of this material may be reproduced or retransmitted in any manner without the prior written permission of NorthCoast. NorthCoast does not represent, warrant or guarantee that this information is suitable for any investment purpose and it should not be used as a basis for investment decisions. © 2022 NorthCoast Asset Management.
PAST PERFORMANCE DOES NOT GUARANTEE OR INDICATE FUTURE RESULTS.
This material should not be viewed as a current or past recommendation or a solicitation of an offer to buy or sell any securities or investment products or to adopt any investment strategy. The reader should not assume that any investments in companies, securities, sectors, strategies and/or markets identified or described herein were or will be profitable and no representation is made that any investor will or is likely to achieve results comparable to those shown or will make any profit or will be able to avoid incurring substantial losses. Performance differences for certain investors may occur due to various factors, including timing of investment. Investment return will fluctuate and may be volatile, especially over short time horizons.
INVESTING ENTAILS RISKS, INCLUDING POSSIBLE LOSS OF SOME OR ALL OF THE INVESTOR'S PRINCIPAL.
The investment views and market opinions/analyses expressed herein may not reflect those of NorthCoast as a whole and different views may be expressed based on different investment styles, objectives, views or philosophies. To the extent that these materials contain statements about the future, such statements are forward looking and subject to a number of risks and uncertainties.
Options overlay strategy does not protect from downside risk. The downside risk protection benefit of a call writing strategy is limited to the amount of the premium received. Portfolio holdings may need to be sold to generate cash to settle options. Such sales may produce tax consequences. Investors must be willing to forgo potential upside appreciation above the premium value in exchange for the incremental income. Options may expire worthless or not perform as expected, resulting in losses.
Options involve risk and are not suitable for all investors. Please refer to Characteristics and Risks of Standardized Options (http://www.optionsclearing.com/about/publications/character-risks.jsp).
Options involve risk and are not suitable for all investors. Please refer to Characteristics and Risks of Standardized Options (http://www.optionsclearing.com/about/publications/character-risks.jsp).