


Current Equity Exposure
A market barometer of our current U.S. and international equity outlook
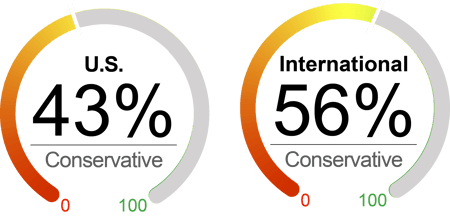
Equities advanced in August with the repricing of recession risks, more evidence of cooling inflation, and expectations of policy rate cuts. The S&P 500 gained 2.4% and the Dow climbed 2.0%, while the technology-heavy Nasdaq underperformed by edging up 0.7%. The beginning of August witnessed significant risk asset selloff as recession fears were triggered by weaker-than-forecast job creation data and a sharp rise in the unemployment rate, among continuing concerns over tech valuation and geopolitical risks. While the market has welcomed the slower pace of inflation and expectation of a September rate cut, debate remains whether the Fed rate cuts are behind the curve. At the overall market level, we believe that the risk-reward for equity markets is challenging in the near term, on weakening activity momentum, timing of Fed policy, rich equity valuation, concentration risk, and election and geopolitical uncertainty. With this backdrop, we maintained our allocation to U.S. equities at 43% and trimmed our international equity exposure to 56%.
What's Driving the Markets?
Labor Market and Recession Fears: The July payroll report showed weaker-than-consensus job creation, with payroll employment rising by only 114,000 in July. At the same time, an increase in the unemployment rate to 4.3% from 4.1% triggered the threshold of a recession indicator, the "Sahm rule, sparking recession fears in the market and exacerbating a risk-asset selloff at the beginning of August. However, we don't want to overread one data point. Empirical data has demonstrated that rapid increases in unemployment usually last for a long time, on an average of 16 months, when a recession occurs. We believe the July jobs report suggests a slowdown rather than a recession. The rise in the unemployment rate was partially due to a surge in the labor force, with the labor force participation rate edging higher to 62.7%. Meanwhile, consumer spending, though cooling, remains relatively robust, with retail sales rising 1% after a 0.2% decline in June.
Jackson Hole and Fed Policy: At the 2024 Economic Policy Symposium in Jackson Hole, Chair Powell delivered a highly anticipated speech and signaled that the FOMC will begin cutting interest rates in September. He noted in the speech that, "the time has come for policy to adjust," stating that his "confidence has grown that inflation is on a sustainable path back to 2 percent," and that, "cooling in labor market conditions is unmistakable." The key questions are the size of the initial cut and the timing of subsequent cuts. Powell emphasized that, "the timing and pace of rate cuts will depend on incoming data, the evolving outlook, and the balance of risks." Market reaction was positive to the speech, with stocks rising after the text of the speech was released. Our baseline prediction is that the Fed will cut 25-basis point in its September meeting, followed by another cut in December, although the probability of a faster pace of cuts has increased with recent data.
Inflation Continued to Moderate: Inflation moderated again in July, with the headline CPI falling 0.2% from June, resulting in a decrease in the year-over-year inflation rate from 3.0% to 2.9%, the lowest level since March 2021. Core CPI (excluding food and energy) rose 0.2% in July, with year-over-year growth slowing down from 3.3% to 3.2%. Shelter inflation was the primary driver of the monthly increase in both headline and core CPI in July, with CPI for shelter rising 0.38% in July from 0.17% in June. However, on an annual basis, the CPI for shelter decreased from 5.2% to 5.1%, its lowest level since early 2022. We believe that shelter inflation will likely continue to cool and contribute to bringing overall inflation down to the Fed’s target. Additionally, the Fed’s preferred measure of inflation, the core Personal Consumption Expenditures (PCE) index, rose 0.2% in July, with the annual rate unchanged at 2.6%. The data aligned with expectations, reinforcing that the Fed’s plan to start cutting interest rates in September remains unchanged.
By the Numbers
Valuation
|
Sentiment
|
Technical
|
Macroeconomic
|


As of 8/31/24. Data provided by Bloomberg, NorthCoast Asset Management, Federal Reserve History.
The NorthCoast Navigator is a market barometer displaying NorthCoast's current U.S. and international equity exposure and outlook. This aggregate metric is determined by multiple data points across four broad market-moving dimensions: Technical, Sentiment, Macroeconomic, and Valuation. The daily result determines equity exposure in our tactical strategies.
NorthCoast Asset Management is a d/b/a of, and investment advisory services are offered through, Kovitz Investment Group Partners, LLC (Kovitz), an investment adviser registered with the United States Securities and Exchange Commission (SEC). Registration with the SEC or any state securities authority does not imply a certain level of skill or training. More information about Kovitz can be found at www.kovitz.com.
NorthCoast and its affiliates do not provide tax, legal or accounting advice. This material has been prepared for informational purposes only, and is not intended to provide, and should not be relied on for, tax, legal or accounting advice. You should consult your own tax, legal and accounting advisors before engaging in any transaction.
The information contained herein has been prepared by NorthCoast Asset Management ("NorthCoast") on the basis of publicly available information, internally developed data and other third party sources believed to be reliable. NorthCoast has not sought to independently verify information obtained from public and third party sources and makes no representations or warranties as to accuracy, completeness or reliability of such information. All opinions and views constitute judgments as of the date of writing without regard to the date on which the reader may receive or access the information, and are subject to change at any time without notice and with no obligation to update. This material is for informational and illustrative purposes only and is intended solely for the information of those to whom it is distributed by NorthCoast. No part of this material may be reproduced or retransmitted in any manner without the prior written permission of NorthCoast. NorthCoast does not represent, warrant or guarantee that this information is suitable for any investment purpose and it should not be used as a basis for investment decisions. © 2024 NorthCoast Asset Management.
PAST PERFORMANCE DOES NOT GUARANTEE OR INDICATE FUTURE RESULTS.
This material should not be viewed as a current or past recommendation or a solicitation of an offer to buy or sell any securities or investment products or to adopt any investment strategy. The reader should not assume that any investments in companies, securities, sectors, strategies and/or markets identified or described herein were or will be profitable and no representation is made that any investor will or is likely to achieve results comparable to those shown or will make any profit or will be able to avoid incurring substantial losses. Performance differences for certain investors may occur due to various factors, including timing of investment. Investment return will fluctuate and may be volatile, especially over short time horizons.
INVESTING ENTAILS RISKS, INCLUDING POSSIBLE LOSS OF SOME OR ALL OF THE INVESTOR'S PRINCIPAL.
The investment views and market opinions/analyses expressed herein may not reflect those of NorthCoast as a whole and different views may be expressed based on different investment styles, objectives, views or philosophies. To the extent that these materials contain statements about the future, such statements are forward looking and subject to a number of risks and uncertainties.